Plz read all 8+six parts of this so I don't have to re-invent the wheel. Our positional adjustments may or may not match the MLB but I didn't include them. My guess is they are already included in the OOTP WAR stat. It is important to note that what I calculate here isn't how much a win is actually
worth, that would depend on how much revenue our team generates for each win over 50 (
@osick87 already posted a great article on why the 90th is
worth a ton more than the 50th win, and I agree with the conclusions that article found. What I'm calculating is how much the WBL market is actually paying for win. What the market is paying and what the wins are worth may or may not be the same. So in short, I will show you how much the WBL market pays per WAR.
http://www.fangraphs.com/blogs/win-values-explained-part-one/
Assumptions made in my calculations:
-There are a bunch of assumptions about "wins"/WAR that might not actually fit the WLB, because I don't think our WAR values add up on top of the "replacement" totals of 50 wins, but lets go ahead and pretend we are in the MLB and the +10 runs = 1 win rule of thumb applies well. Lets assume they do and that 1 WAR = 1 win above a replacement player who will help the team generate 50 wins.
-A team of major league minimum salary "replacement" players is assumed to win approximately 50 games on $490k/year each. So $490k is the "replacement" salary and every dollar over 490k is evaluated
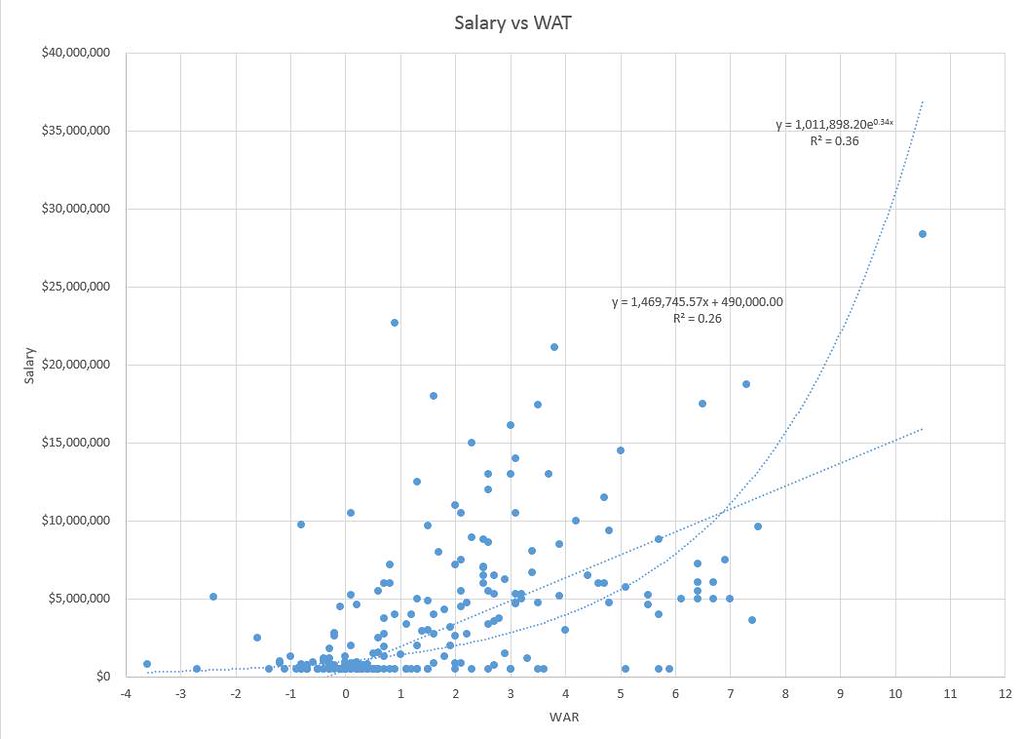
-When you ask "how much is a win worth" you are inherently limiting the analysis to a linear equation. That linear equation probably isn't the best fit for the data and it may show high WAR/high salary players as overpaid, when a line of best fit equation will show that they are actually valued correctly. In the below graph Carrier is a great example of this. The linear fit that says "X wins is worth Y dollars" would mean Carrier is overpaid. He is not overpaid, this is merely a product of ham-fisting a linear fit to your non-linear data.
-I included a non-linear equation as well with a much better fit, just to show that Carrier is not overpriced.
-Generally speaking players under the fit lines are good values. Players over the fit lines are bad values.
-The minimum salary players who produce +WAR values skew this analysis, imo, because their contracts are constrained and not based on the free market. I also ran the analysis without the 490k salary players
Based on this data, +1 WAR is worth approximately 1.47 Million dollars in salary
When I excluded the minimum contract players, the free market value of +1 WAR is worth approximately 1.65 Million dollars in salary