• Registration is disabled due to constant spammers. Email [email protected] and we will temporarily re-enable registration for you.

OOTP Statistical Analysis/Nerding Thread

OU11

Pleighboi
Utopia Moderator
The generally high average WAR values lead me to believe the batters are more prolific than the MLB. Basically we have too many "wins" in the system, if that makes sense. From what I understand about the statistic itself, it is really based on runs and then applied on the assumption that 10 "runs" = win. In our league that might not be true, but it should be easy enough to figure out with a full year of data.
Yeah we're in a talent boom for more reasons than one in this league. There is too much talent.

I already know what the most important stat is for contact but you cant test for it.
 

OU11

Pleighboi
Utopia Moderator
How the devs claim they work and how they actually work might not be the same. I've already found that the "Overall" rating doesn't appear to show what they say it shows.
Everything that you can see is a mystery for a reason, it's all supposed to give a general idea not the key to the secret order
 

Orlando

Well-Known Member
Utopia Moderator
Win cost is actually interesting though. Dig into that instead of wasting time on overall :laughing:
 

Travis7401

Douglass Tagg
Community Liaison
Do you want to know cost per WAR? Or cost per win. The former I can do very quickly, while the latter probably a lot hard and I'll bore everyone. I already bored Osick with that today. The correlation between WAR and wins epends a lot more on our league and the underlying assumption of how WAR is actually calculated based on assumptions made about MLB. Since it is an empirical equation, if there are any differences in our league and MLB, WAR might not be the best proxy for "wins."
 

doh

THANK YOU Dermott McHeshi
You should see if we are worse defensively than the mlb. Doh swears we are
Our average DE is probably the worst (or close to it) in MLB. I've looked deep into it unfortunately with all the Travis charts, it'd look like shit in comparison.

I also don't think WAR is a sure fire way to measure the true talents of players. There are so many variables specifically how much players are misued in the game (mostly played out of position, shouldn't face RHP, etc.). I use the example I did before of Brito on my team. He was by far the worst in WAR last year in the WBL (-3.6).

But this year with my team, not playing in the field, not playing much vs. RHP, etc. I bet his WAR will be 0.5 or something. He's by no means a star but he's just an (extreme) example of how teams badly using players will effect WAR.
 

Travis7401

Douglass Tagg
Community Liaison
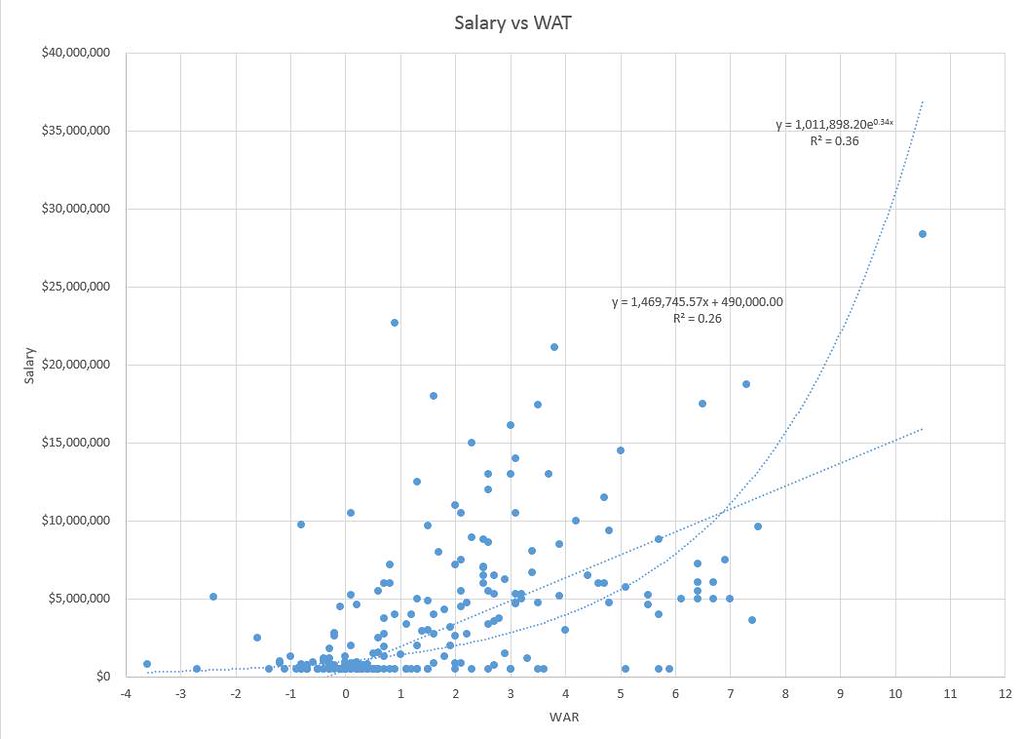
Plz read all 8+six parts of this so I don't have to re-invent the wheel. Our positional adjustments may or may not match the MLB but I didn't include them. My guess is they are already included in the OOTP WAR stat. It is important to note that what I calculate here isn't how much a win is actually worth, that would depend on how much revenue our team generates for each win over 50 (@osick87 already posted a great article on why the 90th is worth a ton more than the 50th win, and I agree with the conclusions that article found. What I'm calculating is how much the WBL market is actually paying for win. What the market is paying and what the wins are worth may or may not be the same. So in short, I will show you how much the WBL market pays per WAR.

http://www.fangraphs.com/blogs/win-values-explained-part-one/

Assumptions made in my calculations:
-There are a bunch of assumptions about "wins"/WAR that might not actually fit the WLB, because I don't think our WAR values add up on top of the "replacement" totals of 50 wins, but lets go ahead and pretend we are in the MLB and the +10 runs = 1 win rule of thumb applies well. Lets assume they do and that 1 WAR = 1 win above a replacement player who will help the team generate 50 wins.

-A team of major league minimum salary "replacement" players is assumed to win approximately 50 games on $490k/year each. So $490k is the "replacement" salary and every dollar over 490k is evaluated

-When you ask "how much is a win worth" you are inherently limiting the analysis to a linear equation. That linear equation probably isn't the best fit for the data and it may show high WAR/high salary players as overpaid, when a line of best fit equation will show that they are actually valued correctly. In the below graph Carrier is a great example of this. The linear fit that says "X wins is worth Y dollars" would mean Carrier is overpaid. He is not overpaid, this is merely a product of ham-fisting a linear fit to your non-linear data.

-I included a non-linear equation as well with a much better fit, just to show that Carrier is not overpriced.

-Generally speaking players under the fit lines are good values. Players over the fit lines are bad values.

-The minimum salary players who produce +WAR values skew this analysis, imo, because their contracts are constrained and not based on the free market. I also ran the analysis without the 490k salary players

Based on this data, +1 WAR is worth approximately 1.47 Million dollars in salary
When I excluded the minimum contract players, the free market value of +1 WAR is worth approximately 1.65 Million dollars in salary


18321446350_d6dac8ab40_b.jpg
 

Travis7401

Douglass Tagg
Community Liaison
I don't have enough data to determine what a teams actual number of wins is worth in revenue. Is that what you are asking for? If so, it probably depends on the team (fan loyalty and such) but after this season I could get an average.

If you are asking for "value per win" I already did that, as mentioned above, but removing the 490k players.
 

osick87

Well-Known Member
Community Liaison
Can you do that for Gauchos? 1.65 has me thinking I am above average on everyone.
 

OU11

Pleighboi
Utopia Moderator
I pay a lot per war, but that number is false. Gjge travlov but that dog just aint gon hunt
 

Travis7401

Douglass Tagg
Community Liaison
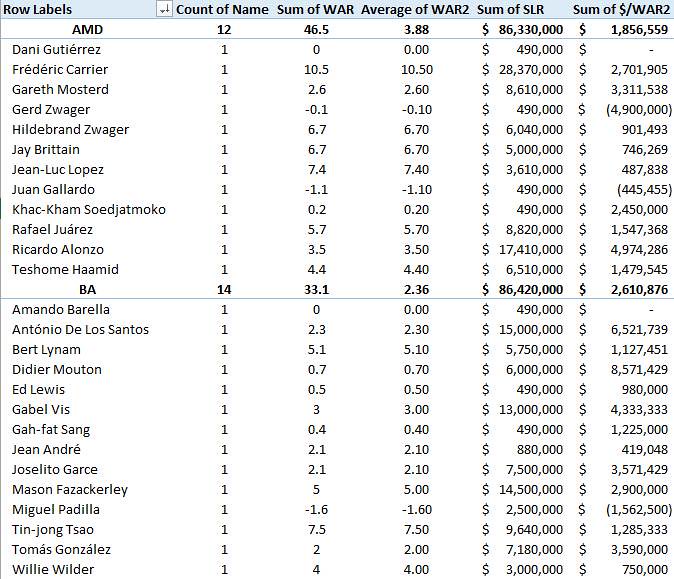
Fortunately, pivot tables make this easy:

OU spending about 1.8 Million/WAR on average for his field players.
Osick spending about 2.6 Million/WAR on average for his field players.

FWIW, the better teams should have to spend more $/WAR for their elite players. That's because 1x6 War player is worth more than 3x2 WAR players. The linear estimate of value does not account for this, which is discussed in part 6 of the $/Win article series I posted.

FWIW, Key West (@Gooksta) is paying the least at 1.0 Million/WAR for their field players.


18325150748_52de0ac9b8_b.jpg
 
Last edited:

OU11

Pleighboi
Utopia Moderator
Fortunately, pivot tables make this easy:

OU spending about 1.8 Million/WAR on average for his field players.
Osick spending about 2.6 Million/WAR on average for his field players.

FWIW, the better teams should have to spend more $/WAR for their elite players. That's because 1x6 War player is worth more than 3x2 WAR players. The linear estimate of value does not account for this, which is discussed in part 6 of the $/Win article series I posted.

18325150748_52de0ac9b8_b.jpg

Okay now do it with just Alonzo and Carrier, since those are the only ones signed to real contracts.
 

OU11

Pleighboi
Utopia Moderator
The reason I said your dog will lay down and not hunt, is because there are three types of contracts. The first is your standard minimum contract that a player will have between 2.1 and 3 years. Then you get ur arb buyout contract that is much cheaper than it should be, my whole team save those two are on one of these.

The last one is when that arb buyout ends and they get the big boi contract. That's when you pay them what they want and that is how much WAT costs.
 

Travis7401

Douglass Tagg
Community Liaison
San Fransisco is technically paying the MOST $/WAR at $12 Million dollars in salary/ 1 WAR and that's mostly because their total WAR for the entire team is only +1.6 because @Reel mismanaged them. They'll definitely come in a lot better this season. This phenomenon shows why I don't really like $/WAR as a stat because the 0 WAR and - WAR values really fuck things.
 

Travis7401

Douglass Tagg
Community Liaison
The reason I said your dog will lay down and not hunt, is because there are three types of contracts. The first is your standard minimum contract that a player will have between 2.1 and 3 years. Then you get ur arb buyout contract that is much cheaper than it should be, my whole team save those two are on one of these.

The last one is when that arb buyout ends and they get the big boi contract. That's when you pay them what they want and that is how much WAT costs.

Then you should be more explicit in what you ask for. The question that was asked was "$/Win" and that's what I gave you by calculating the value based on excluding standard min contracts, Mr. Trapper (1.65 Million). I can calculate another market value without standard min contracts or arb contracts and give you that number, but all you'll be proving is that you are "overpaying" for that last contract based on the player's production.

If you are actually interested in statistics instead of just trolling, try to be less confrontational.
 

OU11

Pleighboi
Utopia Moderator
Then you should be more explicit in what you ask for. The question that was asked was "$/Win" and that's what I gave you by calculating the value based on excluding standard min contracts, Mr. Trapper (1.65 Million). I can calculate another market value without standard min contracts or arb contracts and give you that number, but all you'll be proving is that you are "overpaying" for that last contract based on the player's production.

If you are actually interested in statistics instead of just trolling, try to be less confrontational.
Im drunk and dont have tact, i didnt think about the fact that most of the arb deals are so cheap until after you said the price per war was so low. I guess you could say paying anyone past 28-30 is dumb but if it's possible i wonder what war costs on the open market instead of team controlled.

I didnt think you knew about the arb deals being way less than market so i meant that part as a joke
 

Travis7401

Douglass Tagg
Community Liaison
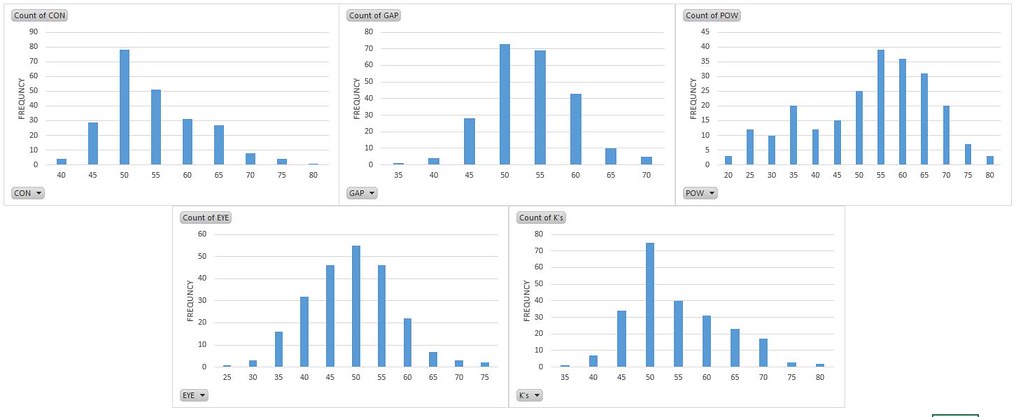
These are the frequency distributions for all hitting ratings in the current WBL. As you can see, normal distributions are generally a good assumption. Power has the most interesting distribution in that it has a high average value, but also shows acceptance of lower values. This shows that Utopians love power hitters, but are still accepting of very low power players in the big leagues as long as they have good ratings in the other hitting categories (this probably has to do with player roles). Utopians seem to value contact the most, as it is the only rating in which no player in the WBL has a value of less than 40.

18325945220_158f471034_b.jpg
 
Last edited:

Orlando

Well-Known Member
Utopia Moderator
I don't know if there are many hitters below 40 contact.

I have pretty much always valued power over contact so those trends are interesting. I think it's just the players we have available to us rather than being accepting of low power.
 

Travis7401

Douglass Tagg
Community Liaison
Im drunk and dont have tact, i didnt think about the fact that most of the arb deals are so cheap until after you said the price per war was so low. I guess you could say paying anyone past 28-30 is dumb but if it's possible i wonder what war costs on the open market instead of team controlled.

I didnt think you knew about the arb deals being way less than market so i meant that part as a joke

Oh I definitely agree with you about WAR costing more on the open market. I think the graph shows that our free agent market is drastically overvalued league wide when compared to their production. Look at all the $15 Million dudes and notice that the wins they are producing aren't much above those of the $5 Million/tier (arb guys mostly). I think the reason we "overpay" for these guys is obvious and that's because they are really the only ones that we have the opportunity at on the open market, like you said. Still, if you can get good levels of production by moving AAA guys up through your system, the numbers show you obviously should.

I tried to find a way to list the "contract type" or something similar in OOTP in the "sortable stats" deal, but couldn't find anything.
 

Travis7401

Douglass Tagg
Community Liaison
I don't know if there are many hitters below 40 contact.

I have pretty much always valued power over contact so those trends are interesting. I think it's just the players we have available to us rather than being accepting of low power.

Certain positions do have character "types" that typically do have low power (SS) and then you have managers who do seem to be okay with lower power even when they have high payrolls. For instance, Buffalo has average power ratings of below 50 and they definitely aren't fielding scrubs. Their contact and Ks ratings are nearly 60 on average.
 

Orlando

Well-Known Member
Utopia Moderator
If there was a power bat out there it is probably taken though. Lloyd definitely likes those high average hitters though.
 

Travis7401

Douglass Tagg
Community Liaison
If there was a power bat out there it is probably taken though. Lloyd definitely likes those high average hitters though.

Yeah, that's why it was a cool distribution. The fact that it was the only hitting stat that had 55 rating as the most frequent is telling in how everyone values power the most (and it has by far the most 60 and 65 ratings as well). It was simultaneously the most forgiven rating for low values as well, as it had the lowest rating. Just interesting to me that we covet power hitters but the second they drop below 45 it is almost like we say "fuck it power might as well be 25" as long as the other ratings are good.

I think you are right about it having a lot to do with the available player pool.
 

OU11

Pleighboi
Utopia Moderator
I have so many questions but i dont want to know the answers. I'm hugely interested in analysis of current player trends though . It'll help us know if a change is needed.
 

Travis7401

Douglass Tagg
Community Liaison
Here is a breakdown of each position with some average ratings ("Def" is their defensive rating at primary position) and then the average stats they had in 2048 (stats as picked by @Yankee151). I sorted by the average salary to show which positions are highest/lowest paid on average in the WBL. As we speculated above, the player pool in certain positions just seems to be lacking power, the MIFs especially average in the low 40s for power across the player pool at the WBL level. To me, the CF position looks like the best in WBL right now, also the best defensive position on average.

18343717799_b020a55852_o.jpg
 

OU11

Pleighboi
Utopia Moderator
Nice, i knew catcher was the worst but it is by a fair amount. Thought that and 3B were the weakest followed by ss. Surprised 1B is so low
 

Wolfman21

Well-Known Member
surprised CF is the highest by a longshot. Every outfielder I put at CF has a higher potential than they do at corner outfield spots. I wonder why that is
 

Travis7401

Douglass Tagg
Community Liaison
These are the frequency distributions for all hitting ratings in the current WBL. As you can see, normal distributions are generally a good assumption. Power has the most interesting distribution in that it has a high average value, but also shows acceptance of lower values. This shows that Utopians love power hitters, but are still accepting of very low power players in the big leagues as long as they have good ratings in the other hitting categories (this probably has to do with player roles). Utopians seem to value contact the most, as it is the only rating in which no player in the WBL has a value of less than 40.

18325945220_158f471034_b.jpg

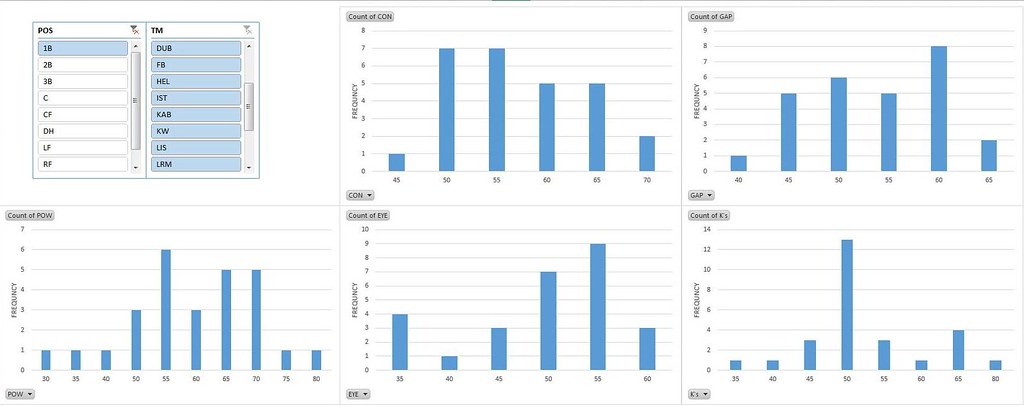
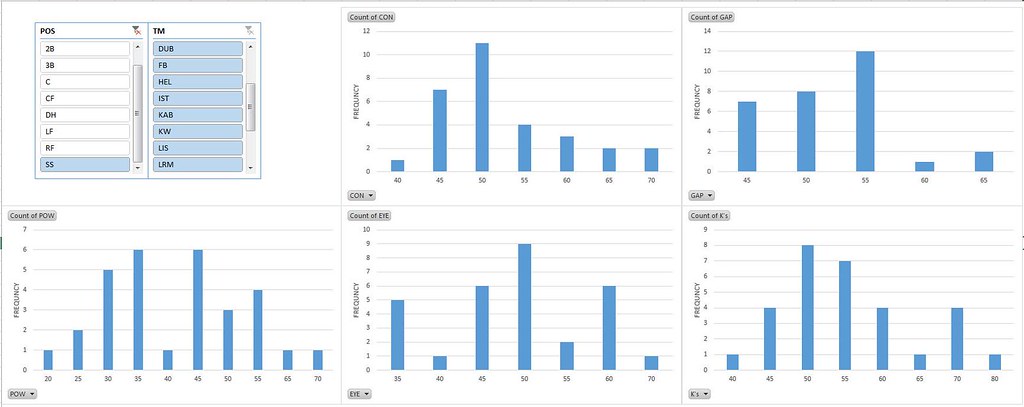
I added some slicers for position and team to my pivot tables and I figured I'd show you the difference in hitting rating distribution for 1B and SS

1 Base

18350511329_f176e3719e_b.jpg


Shortstop

18532279172_9fde1f926a_b.jpg
 

Travis7401

Douglass Tagg
Community Liaison
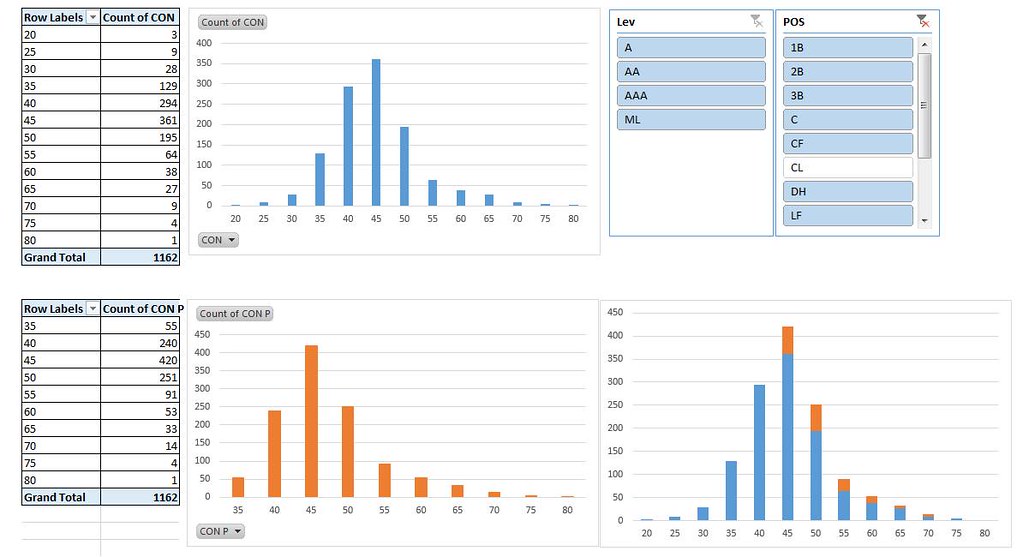
I added all the levels from AAA down to A to my database and made a set of pivot tables to compare frequency distributions of any current rating to the potential rating and then slice by whatever level or position you'd like.

Here is an example of the frequency distribution for contact ratings for all the batters in our world from A-WBL in our world (pitchers sliced out) Plue Graph is distribution of current ratings. Orange graph is distribution of potential ratings. Third graph shows where potential ratings exceed current ratings. I can quickly switch from any rating or slice by any position or level, so if you are interested in seeing anything specifically (@OU11 you mentioned something about this) just let me know.

17925356413_052156f89d_b.jpg
 
Top