-
Registration is disabled due to constant spammers. Email [email protected] and we will temporarily re-enable registration for you.
You are using an out of date browser. It may not display this or other websites correctly.
You should upgrade or use an alternative browser.
You should upgrade or use an alternative browser.
Beardown About...Rose Bowl #0
- Thread starter gilstein21
- Start date
BearDownUofA
Festizio
It'd be nice but I won't be shocked if we're not.Will Arizona even be ranked? Sec
BearDownUofA
Festizio
RichRod is 2-1 against Oregon. The fuck?
Brick
Well-Known Member
That nd team was the fucking worst.They should've played in 2012. Notre Dame ruins everything
Oregon choked in that furd game. I think that's still the best game Kevin Hogan ever played.
I think he converted 20 3rd and whatevers with ridiculous scrambles.
Brick
Well-Known Member
Man I miss STOOOOOOOPSRichRod is 2-1 against Oregon. The fuck?
MtneerManiac
Burning Couches
Thanks for keeping corch BitchRod warm for us in case Holgomania fucks up
BearDownUofA
Festizio
Maybe make it round-robin like the Commander-in-Chief's trophy?They really need to make this a rivalry game. The "hot California girls that were too dumb to get accepted in-state" bowl. Trophy is an empty bottle of cotton candy vodka.
or maybe that should be uo-asu
Fuck you he's ours.Thanks for keeping corch BitchRod warm for us in case Holgomania fucks up
bruin
Well-Known Member
Maybe make it round-robin like the Commander-in-Chief's trophy?
Fuck you he's ours.
Was waiting for it.

BearDownUofA
Festizio
GameDay to Tucson next week?
I should start a Facebook page.
I should start a Facebook page.
BearDownUofA
Festizio
And Arizona still has yet to have a multi-year starter at QB under RichRod. If Anu is this good right now I'm excited to see how well he does when he's got a full year of experience under his belt.
silverwheels
PLAY LA BAMBA BABY
more BearDown splooge plz
Mame YO
slings rocks
Well I guess the pac12 champ could be a 1 loss and make the playoff, but now there's a reel good chance two SEC teams get picked IMO. FSU has an easy schedule, so they probably will make it. Sec champ is in. Oklahoma. That leaves a 1 loss pac12 champ, an sec team and MAYBE msu or notre dame as contenders for the last spot.
For oregon, they'll have to run the table and maybe get a rematch with Arizona. If the offensive line gets better (healthier) the selection committee might give Oregon a pass for this loss. Dat defense doe... I don't think Oregon wins a shampionship even if they somehow made the playoff, and tbh at this point I smell another loss on the schedule.
Kelly era over, indeed.

Brick
Well-Known Member
mame right about the defense. without armstead (who was out the second half) and buckner the talent level is pretty embarrassing in the front 7.
I ain't even mad this mroing. the loss at home vs Stanford two years ago made me mad. the loss at usc three years ago made me even more mad. those are games Oregon prolly should have won.
injuries aside, the team isn't nearly at the level they were a few years ago.
I ain't even mad this mroing. the loss at home vs Stanford two years ago made me mad. the loss at usc three years ago made me even more mad. those are games Oregon prolly should have won.
injuries aside, the team isn't nearly at the level they were a few years ago.
I just see a bunch of thinly veiled homerism from brick. He's no better than Nebraskafans.
PSUEagle
Well-Known Member
Gotta give Rodriguez his props, mayne: not a fan of his passing game, but his run game is so well conceived/organized that pretty much any athletic QB he plugs in is going to lead to a good offense.
The key for his teams over the years is how well his defense plays. If Casteel can get them to a level at or close to what he did at WVU in the mid aughts, then Arizona's going to be a legit threat to make the championship game. If they play like they've mostly done his first couple years? 8 wins at best.
The key for his teams over the years is how well his defense plays. If Casteel can get them to a level at or close to what he did at WVU in the mid aughts, then Arizona's going to be a legit threat to make the championship game. If they play like they've mostly done his first couple years? 8 wins at best.
Last edited:
coogrfan
Well-Known Member
That's a shitty way to lose the game for Houston.
Me last night:

- Houston falls to 1-13 under Tony Levine when trailing at halftime.
- Houston fails to score an offensive td for the first time since 2003.
- TONY LEVINE (and idiot OC Travis Bush) MUST GO!
Last edited:
coogrfan
Well-Known Member
The perfect metaphor for both the Houston-UCF series and University of Houston football in general.
Renegade
Charge on!
The perfect metaphor for both the Houston-UCF series and University of Houston football in general.
That's the ultimate example of coogin it isn't it?
And you guys should be pissed at Levine and the coaches. 3 times you had 12 men on the field? One time you were scrambling a guy on the field to get 11 on the field. That's just piss poor management by the coaches.
I ain't even mad this mroing.
This is a miracle any day, let alone following a Oregonian loss.
silverwheels
PLAY LA BAMBA BABY
AWW SKEET SKEET MUHFUKKAAAAAA

GuyIncognito
pressure cooker full of skittles
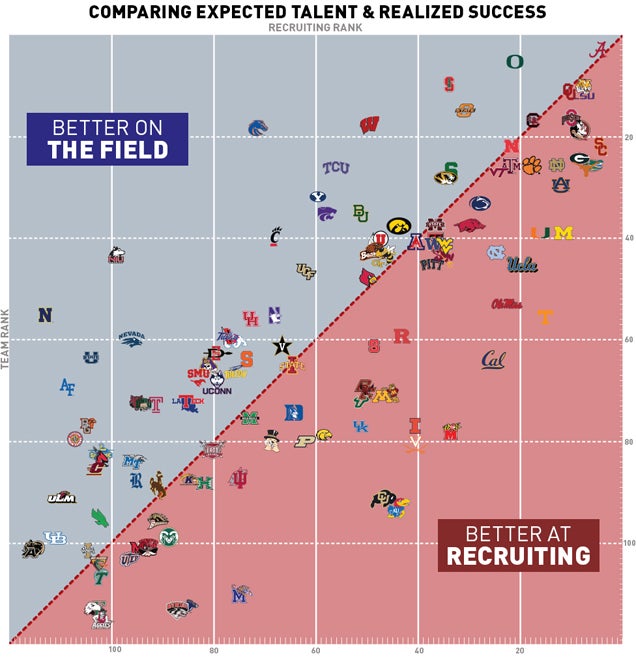
I thought this was interesting. Assessing recruiting rankings vs. on-field performance over the last 5 seasons.
Wooly
Well-Known Member
Boise the most impressive team on that list to me. Actual rankings (or whatever these are, Sargins?) have a bit of a glass ceiling for them, yet they still get ranked. However, they do it from a pretty poor recruiting ranking. Look how far down
they are in recruiting for what they achieve. They are about 70th in the nation, and that is even 20 spots below Wiscy at about 50th.
Tenn makes you laugh, but then Mich and Miami are not much better. Consistent recruiting from 10-20, and they can't get above 40 as an avg team rank? For shame.
Nice graph Mak. Can you post the source, so we can look at the methodology.
RedmondLonghorn
#LOB
Boise the most impressive team on that list to me. Actual rankings (or whatever these are, Sargins?) have a bit of a glass ceiling for them, yet they still get ranked. However, they do it from a pretty poor recruiting ranking. Look how far down
they are in recruiting for what they achieve. They are about 70th in the nation, and that is even 20 spots below Wiscy at about 50th.
Tenn makes you laugh, but then Mich and Miami are not much better. Consistent recruiting from 10-20, and they can't get above 40 as an avg team rank? For shame.
Nice graph Mak. Can you post the source, so we can look at the methodology.
Yeah, based on the chart BSU and Northern Illinois are the absolute best at maximizing their talent. Navy looks good too, but the service academies are a whole 'nother thing.
If this chart didn't include 2012 and 2013 and was the five years ended 2011, Boise State would have just about broke the model completely.
Boise the most impressive team on that list to me. Actual rankings (or whatever these are, Sargins?) have a bit of a glass ceiling for them, yet they still get ranked. However, they do it from a pretty poor recruiting ranking. Look how far down
they are in recruiting for what they achieve. They are about 70th in the nation, and that is even 20 spots below Wiscy at about 50th.
Tenn makes you laugh, but then Mich and Miami are not much better. Consistent recruiting from 10-20, and they can't get above 40 as an avg team rank? For shame.
Nice graph Mak. Can you post the source, so we can look at the methodology.
http://regressing.deadspin.com/char...teams-outplay-their-recruit-1640831522/+benes
MtneerManiac
Burning Couches
Arizona's 3-3-5 has looked good against Oregon. Even in that game 2 years ago, where they lost 49-0, that was mostly due to Matt Scott throwing 25 pick sixes and Zona going like 0/7 in the red zone.
DickRod is 53-15 with Casteel. Without? See Michigan.
I still hope Dana succeeds because seasons like last season make my physically ill, but if worst comes to worst ...
BRING BACK DICKROD.

Wooly
Well-Known Member
There are a few confounding factors to consider here though. If you count the number of teams in and out of Power 5 confs which are off the line, and do it on both sides of the line, you see a trend that is telling. The split is something like 3:1 for Power 5 teams underachieving, and the opposite 1:3 for overachieving. That sure seems like a product of the test or process, and not a random result which was truly based on how well a team did with what it had. I am guessing this is more do to the vagary of recruiting much more than Massey's rankings. To be sure, there are non random influences about rankings which could help produce skewed results (like the fact that Power 5 teams are much more likely to be ranked when they don't deserve it, compared to non-Power 5 teams). However, rankings are probably even more skewed. Recruiting rankings are largely marketing efforts to make money from the fans of Power 5 schools, and they are certainly extremely relative to the schools involved. I mean they start identifying good players in large part by how many, and which, Power 5 school is looking at the kid. A players ranking even moves based on who offers him a scholi, and which teams he signs with. Other than the Top 100 or so kids though, the rest is probably a complete coin flip, and the ratings are actually more determined by the interest of a Power 5 school, than anything else. That means the Power 5 schools are actually overrated for their recruiting rankings every year (especially the bottom half of the Power 5, where most of the underachievers are), which creates a systematic underachievement in that graph.
It's similar to that graph that came out sever years ago trying to show trends on how teams move up the rankings from where they start. Of course it showed that major programs were not moving as well as lesser known programs. This was obvious once you thought about it, because the major schools started the year ranked high, and had no where to move up the rankings. Of course this graph is far superior to that old one, but this graph also seems to have confounding factors biased against Power 5 schools as well. Just something to keep in mind. You can still laugh at Tenn, but keep in mind that kid with a 3 or 4 star on their teams may really just be a 2 star if he went to TCU, and TCU looks all the better for it.
It's similar to that graph that came out sever years ago trying to show trends on how teams move up the rankings from where they start. Of course it showed that major programs were not moving as well as lesser known programs. This was obvious once you thought about it, because the major schools started the year ranked high, and had no where to move up the rankings. Of course this graph is far superior to that old one, but this graph also seems to have confounding factors biased against Power 5 schools as well. Just something to keep in mind. You can still laugh at Tenn, but keep in mind that kid with a 3 or 4 star on their teams may really just be a 2 star if he went to TCU, and TCU looks all the better for it.
Mame YO
slings rocks
After a proper bit of mourning, a thought has solidified in my mind - not an excuse, but here it is:
the pac12 is WAY more competitive than it was from 2010-2012. 2010 - oregon's nation championship appearance season - featured blowout after blowout. 2011 was a weak year for the ducks (especially defensively), and they still really only went down to traditionally good teams (LSU, USC) and never really had any other issues in the regular season. Both of those years Oregon beat Luck-led Stanford teams, too.
But after that (and to me 2012's fiesta bowl team was the best Oregon team of all time) there has been a big shift. With all those coaches that were hired, and all that money flooding the PAC, it seems like everyone has caught up. Oregon was stomping teams like Arizona and ucla 49-0 and 60-13 and it was just rape.
And so I get to the point... Just how good were those ducks teams in down years for the PAC? Certainly all these other teams have improved drastically, but just how far has Oregon fallen really? Are we just overreacting to oregon's losses because we're used to all these other PAC teams just not being very good? Or has Oregon truly regressed? To me, the best answer is that it's both, but that we're also probably overestimating oregon's regression. The offensive line has always had holes (see Stanford the last two years, blitzing A gaps all night)... The defense has always shown a tendency to bend at times. Maybe the other teams are just finally able to exploit those weaknesses more consistently. Idk. it is interesting doe, and even brings a bit of nervous excitement to every single game the ducks play (as opposed to every game being over halfway through).
Also, I think the narrative would be different if this was the SEC we were talking about. If bama lost to an undefeated yet unranked SEC team there would be calls of "omg the sec is just so deep!"... Maybe the sky is NOT falling. Maybe the pac12 is just really fucking good now. Hopefully that elevates Oregon and other west coast programs over the long run, even as teams like Oregon will now have to adjust to a grueling week-to-week schedule of doom.
DanishDonut0
Well-Known Member
@Brick what happened to outside running plays and play action to WR screens? Didn't see much of it. I've felt the majority of pass plays called under Helfrich are always deep/long developing. Little to none quick passes, can't do that with this line. Offensive playbook looked bland as fuck.
I also really enjoyed the 3rd and 20 something run conversion in the 4th quarter, saw it coming. No way we run the table.
I also really enjoyed the 3rd and 20 something run conversion in the 4th quarter, saw it coming. No way we run the table.
MtneerManiac
Burning Couches
Syracuse is the shittiest stadium in the world for a TV game. The angles on the cameras blow.
BearDownUofA
Festizio
Looking back to 2010, holy shit, I forgot how much of that season Arizona spent in the top 25. Arizona was ranked for all but their first and last regular season games, along with the bowl game.
Too bad that the end-of-season collapse after the UCLA win was the beginning of the end for Stoops, but since his firing next season brought us RichRod, it could've been a lot worse.
Too bad that the end-of-season collapse after the UCLA win was the beginning of the end for Stoops, but since his firing next season brought us RichRod, it could've been a lot worse.
joshuahuskers
Utopia Football League
Well, Nebraska is pretty average on that graph. Perform right where they recruit. About right for a mediocre football program.
Rutgers Mike
Dr. Sad
Syracuse is the shittiest stadium in the world for a TV game. The angles on the cameras blow.
It's the shittiest stadium period. Named after an air conditioning company, yet no air conditioning in the building. Another team Rutgers will never play again. Thank god.
Well, Nebraska is pretty average on that graph. Perform right where they recruit. About right for a mediocre football program.
I don't think we're mediocre. I think we're second tier though, which is traditionally mediocre by our standards.