• Registration is disabled due to constant spammers. Email [email protected] and we will temporarily re-enable registration for you.

Travis7401's Newsletter! Subscribe Today!

Wooly

Well-Known Member
Do you do anything with salaries? I sometimes do when planning extensions and I hate copy and pastaing into excel or googlesheets and having to retype all the salaries so they are recognized as numbers. What wizardry does it have to make that streamlined
Write a script to pull from html tables in the format you want. But usually it's pretty easy to paste values and get it how you want it.
 

Gooksta

Well-Known Member
I'll look at it. I have not put a lot of time into that analysis, concentrating on the pitching thus far. I set the handedness to be as alternating as possible. That way it's harder to use a reliever to get past a run producing situation late in games. Our team is about generating runs, so we win a lot of games by beating up on relievers, even if the starter was good.
I wish ootp had a "pitches seen per plate appearance" stat. Avoid k guys can foul off pitches a ton, but I think high "eye" guys tend to do better
 

Travis7401

Douglass Tagg
Community Liaison
You can tell my immersion is HIGH when I actually use the BTT Tool to analyze my depth chart! I'm predicting 21.4 BATTER WARS based on my current 13 position players. It is funny to compare this depth chart back to previous versions I posted where I had more BATTER WARS predicted, but also had less consistency and depth.

PREDICTION = 87-92 wins
-Batter Wars = 21

-Based on the quality of my starting rotation and bullpen I figure I'll get another 20-25 WARS from pitching. Probably the best pitching staff I've ever had.
-Assuming replacement level players get 46 wins

Areas I could/should upgrade to optimize the roster:
1. Backup Catcher
2. Swap one of the LHB 1Bs for a big RHB for platoon possibilities
3. Could upgrade at LF


41396794661_a83eb21618_b.jpg
 

Travis7401

Douglass Tagg
Community Liaison
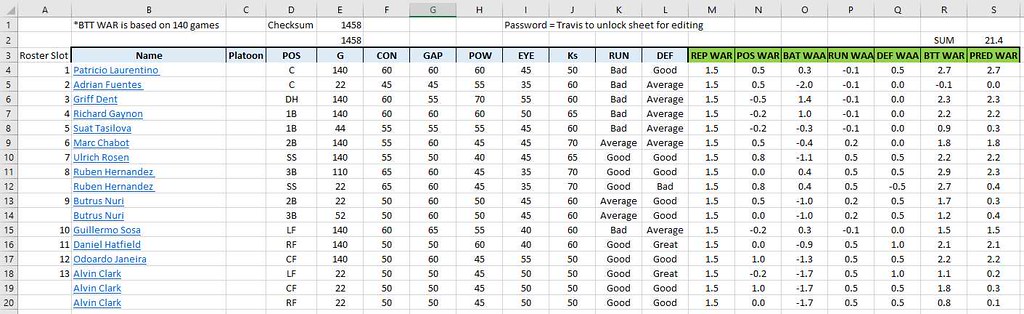
I've been fiddling with my TOOL based on last seasons statistics and I've noticed a few changes to our league!
1. GAP seems to be a good bit more valuable than it used to be, and Eye/Ks took a bit of a drop.
2. GREAT/GOOD defense seem less valuable compared to league average. I think this is because the average defender in the league is better than when I first made the tool.
3. I'm tweaking position values a bit now that I am actually looking at players who play the position (rather than what you have their position listed as)

Here's a chart of all the players who played at least half the season at DH! My biggest error is on @Mr. Radpant's NAIL HOOK because I have his predicted WAR down at 2.1 and his actual WAR was 6.1. My TOOL has always had trouble with this type of bat, but interestingly Halewijn Villoldo from @Rutgers Mike has a very similar type of bat and my predicted WAR tool over-predicted him by a bit. I will continue to post the charts for other positions as I finish them!

1566166441380.png
 

hayvis

Will-Gnome Member
I don't know the game yet, but is there a hidden story arc programmed in players to a certain extent? Bello just seems to persistently outperform his admittedly great ratings. I just get the impression that he's coded as the GOAT.
 

Travis7401

Douglass Tagg
Community Liaison
I don't know the game yet, but is there a hidden story arc programmed in players to a certain extent? Bello just seems to persistently outperform his admittedly great ratings. I just get the impression that he's coded as the GOAT.

He's an awesome player, but not even close to CARRIER in his prime. This was also basically a career year hitting for him and he's still playing great defense too, so you're seeing the top end of his potential. Last year was below average for him. I think he'll be resembling that 4-5 WAR player more in the future rather than 7-8 WARS. Players get boosts from morale and team chemistry/morale. Since he was playing for a team that was running through everyone last year, that helps explain why he did extra well!
 

Travis7401

Douglass Tagg
Community Liaison
Here are the players with more than half the season played at 2B. I had to bump the Position adjustment from 0.5 > 0.6 because the average defense for 2B is now much better! The average 2B in the league now has a range of 55, arm rating of 50, error rating of 60, and a 2B rating of 60.


1566185750134.png
 
Last edited:

Travis7401

Douglass Tagg
Community Liaison
Here are the players that started at SS for more than half the season. The SS players show the defensive mindset in our league even more profoundly. The AVERAGE SS has range of 65, arm of 60, TDP 70, error 70, and SS rating of 65. The average defender at this position is so much better that I had to up the POS WAR from 0.8 to 1.1

1566186497591.png
 

Travis7401

Douglass Tagg
Community Liaison
Did he play 80 games at one position? If not, I'll get to him when I cover UTILITY TALISMEN

Edit: Nevermind, I see wat ur sayin. I hide the column with TALSIMAN WARS because I don't wanna give all my secrets away!
 

Yankee151

Hot Girl Summer
I'm probably moving him to 3B where he'll be a gold-glove candidate next year, maybe platooning him since he's so bad against Lefties. Should be good for 1.5 next year!
 

Travis7401

Douglass Tagg
Community Liaison
Last one from the night, here are ur 3B boys who play half at least half the season. Had to up the position value on this one as well, though there wasn't that much spread in the defensive ratings.

1566187914441.png
 

hayvis

Will-Gnome Member
@Travis7401 should do some personality profile spreadsheets or at least cross reference similar players with reference to this. I think they'd reveal more patterns than stats/ratings. This game has a highly programmed narrative.
 

Rutgers Mike

Dr. Sad
Last one from the night, here are ur 3B boys who play half at least half the season. Had to up the position value on this one as well, though there wasn't that much spread in the defensive ratings.

View attachment 8637
To be fair I shook things up the last 2 months of the season to play 35-21 ball after 47-59 play the first 4 months by moving Munoz to a super sub role and letting Fidi and his terrible range man the hot corner. To be fair I also added Stinson and Otero’s bats to the lineup.
 

Orlando

Well-Known Member
Utopia Moderator
I don't know the game yet, but is there a hidden story arc programmed in players to a certain extent? Bello just seems to persistently outperform his admittedly great ratings. I just get the impression that he's coded as the GOAT.
The ratings are only OSA and your scout’s opinion of the player.
 

Travis7401

Douglass Tagg
Community Liaison
CF was a bit odd this year because of the horrible -ZR put up. This made the position less valuable on average defensively, though the best players put up more ZR gaining that defensive value back. I adjusted the position value down for CF for this exercise, but this really has me considering combining the defensive and positional values into the same category for my predictions.

1566357172170.png
 

Travis7401

Douglass Tagg
Community Liaison
Is your run and defense based on performance or ratings?

So the run and defense "fuzzy ratings" in the BTT is based on the ratings. I also did performance based stats to compare and it is pretty clear that OSA is often lagging on the player's range ratings. Typically the older players have worse defensive stats than their ratings would suggest. I'm going to do a bit more of a thorough breakdown on fielding ratings vs stats later.
 

Travis7401

Douglass Tagg
Community Liaison
The running ratings/stats are so hard to pin down that I might just give up on that. I think it is fair to say that a guy with 70+ on all 3 running ratings adds some value, whereas a guy with sub 40s on all running stats loses some value, but it is really hard to prove this statistically since SB is the only thing I can look at really well and that depends on strategy and other players (pitcher and catcher) ratings as well. Plus you have to consider how faster/better base runners add value by stretching singles to doubles and stuff like that. The very best base stealers can add over 1 WAR to their total, but I think it is fair to assume a max added value of 0.5 WAR for the best base runners (70+ in all areas) and subtract 0.2 for all guys with terrible running stats.
 

hayvis

Will-Gnome Member
The ratings are only OSA and your scout’s opinion of the player.
If the true parameters of the player are completely hidden, it makes it even more likely that the players are on the rails.
 
Last edited:

Travis7401

Douglass Tagg
Community Liaison
I thought Nuh was like a 75 3B, so I wasn’t sure how he was just gud

Thanks for catching that, I'll check the 3Bs because it looks like that column didn't get sorted properly. Vreke is certainly not GREAT defense and Nuh shouldn't be set as AVERAGE either. That could really help explain why the 3B numbers were so wonky and I had to add position value to them.

All that being said NUH's statistical performance was more in line with a "good" 3B, since he had a ZR of +2.5 and "Good" gets you +0.3 WAA (Wins Above Average). Then I have to take and assign a "position" value to determine how much better "average" performance at that position is compared to a "replacement." I'll probably get rid of that extra step in the future and just assign ratings based on defense, wherever you chose to play them.
 
Last edited:

Travis7401

Douglass Tagg
Community Liaison
If the true parameters of the player are completely hidden, it makes it even more likely that the players are on the rails.

The players have actual ratings, but we don't get to see those ratings... we see OSA's opinion of how good a player is. It adds an element of uncertainty that is extremely necessary!
 

Orlando

Well-Known Member
Utopia Moderator
Thanks for catching that, I'll check the 3Bs because it looks like that column didn't get sorted properly. Vreke is certainly not GREAT defense and Nuh shouldn't be set as AVERAGE either. That could really help explain why the 3B numbers were so wonky and I had to add position value to them.

All that being said NUH's statistical performance was more in line with a "good" 3B, since he had a ZR of +2.5 and "Good" gets you +0.3 WAA (Wins Above Average). Then I have to take and assign a "position" value to determine how much better "average" performance at that position is compared to a "replacement." I'll probably get rid of that extra step in the future and just assign ratings based on defense, wherever you chose to play them.
He got all his exp at 3B this season, so I imagine the stats will improve to more closely match whatever his rating is.
 

hayvis

Will-Gnome Member
The players have actual ratings, but we don't get to see those ratings... we see OSA's opinion of how good a player is. It adds an element of uncertainty that is extremely necessary!

I would imagine there's more to it than just a set of ratings.
 

hayvis

Will-Gnome Member
Correct, it's their other ratings, the personality ratings

Yeah. Other than that there will probably be a bunch of stuff not to let them rely on this too heavily either. Unless the indy devs are that clever, which they aren't.
 

hayvis

Will-Gnome Member
Hayvis, you should start a quickplay MLB game and open the player editor if you want to see what's under the hood! This is how that fuck Wooly got his players on the ROIDS

You can also read this handy game manual that describes how the player model works!

https://manuals.ootpdevelopments.com/index.php?man=ootp20&page=the_player_model

Thanks for the link. I literally read the first thing that I found on that, and it spoke of hidden ratings, which is basically what I was eluding to.
 
Top