-
Registration is disabled due to constant spammers. Email [email protected] and we will temporarily re-enable registration for you.
You are using an out of date browser. It may not display this or other websites correctly.
You should upgrade or use an alternative browser.
You should upgrade or use an alternative browser.
OOTP Statistical Analysis/Nerding Thread
- Thread starter Travis7401
- Start date
Mr. Radpants
Trog Five Standing By
Give me +20 range to Paco
Mr. Radpants
Trog Five Standing By
Can we just get injuries on Qualcomm's players above zero?
Here is a graph showing the results of the Multi-Variable Linear Regression predicted WAR vs the observed WAR in 2049. You can see this fit is quite a lot better than the fit provided by "Overall." The non-linear regression analysis I did is even a little tighter fitting than this, but it is more confusing and not as straight forward to explain.
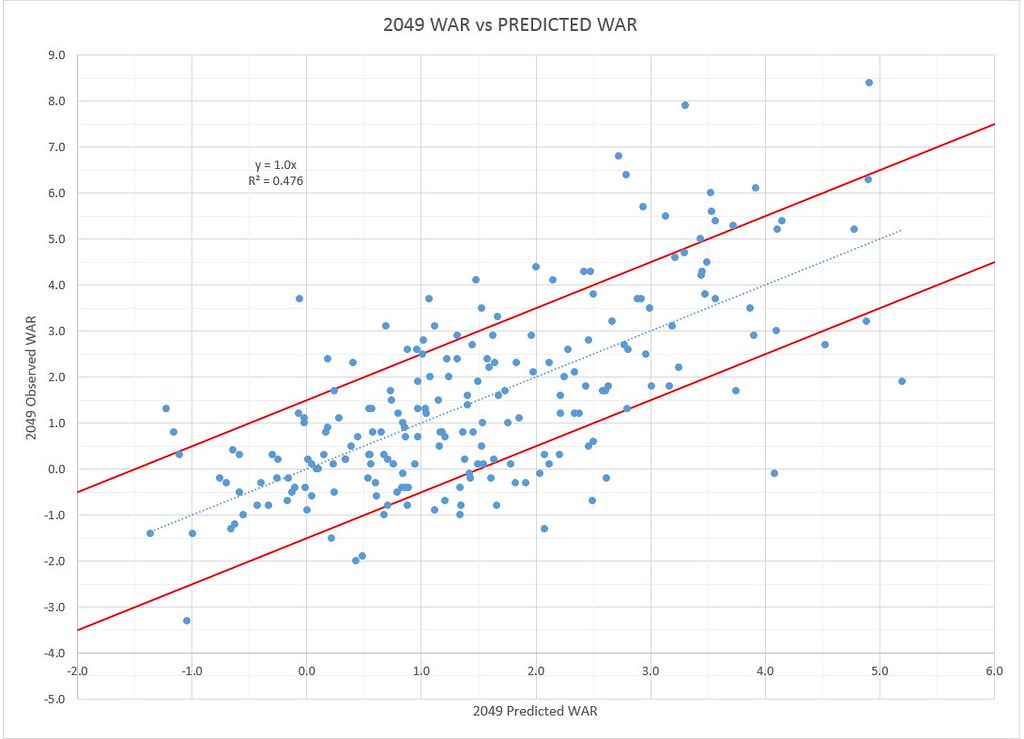
As you can see, the Standard deviation is only 1.5 and the data is well described by a normal distribution, with about 2/3rds of that data fitting inside those red standard deviation bands.
BUMP!
I fine tuned this data and broke it down more like actual WAR is calculated. I now have a much better regression equation (thanks to enough data to break down by positions as well) and now have an R2 value of 0.68!
I did this by breaking WAR prediction down into the following categories, like FANGRAPHS or whatever would (based on 600 ABS, the regression is adjusted base on a player's actual ABs)
Replacement Value - (about 1.5 wars just for showing up and taking 600 hacks at the ball, this is lower than the MLB value which is closer to 2.0)
Position Value - (Lowest in our league is DH at -0.5 WAR and Highest is CF at 1.0 WAR, this doesn't really match MLB fwiw
Bat - This makes the most WARS WON in this order: (Contact, Power, Eye, then Gap and Ks tied)
Base Running - Elite base runners can add 0.5 WAR, terrible ones can subtract 0.1, average runners add 0.2 WAR
Defense - 50 Defense = +0 WAR, 80 Defense = +0.9 WAR
Talisman - Douglass Tagg adds 10 wins to the riggers. SCIENCE
Some examples:
[xtable=skin1]
{tbody}
{tr}
{td=164x@}Name{/td}
{td=64x@}POS{/td}
{td=64x@}CON{/td}
{td=64x@}GAP{/td}
{td=64x@}POW{/td}
{td=64x@}EYE{/td}
{td=64x@}Ks{/td}
{td=64x@}SPE{/td}
{td=64x@}STE{/td}
{td=64x@}RUN{/td}
{td=64x@}DEF{/td}
{td=64x@}REP WAR{/td}
{td=64x@}POS WAR{/td}
{td=64x@}BAT WAR{/td}
{td=69x@}RUN WAR{/td}
{td=69x@}DEF WAR{/td}
{td=64x@}BTT WAR{/td}
{/tr}
{tr}
{td}TROG{/td}
{td}DH{/td}
{td}45{/td}
{td}45{/td}
{td}45{/td}
{td}45{/td}
{td}45{/td}
{td}20{/td}
{td}20{/td}
{td}20{/td}
{td}40{/td}
{td}1.5{/td}
{td}-0.5{/td}
{td}-2.5{/td}
{td}-0.1{/td}
{td}-0.31{/td}
{td}-1.9{/td}
{/tr}
{tr}
{td}Mr. 50 AAAA 1B{/td}
{td}1B{/td}
{td}50{/td}
{td}50{/td}
{td}50{/td}
{td}50{/td}
{td}50{/td}
{td}50{/td}
{td}50{/td}
{td}50{/td}
{td}50{/td}
{td}1.5{/td}
{td}-0.2{/td}
{td}-1.2{/td}
{td}0.2{/td}
{td}-0.01{/td}
{td}0.3{/td}
{/tr}
{tr}
{td}Solid 3B Man{/td}
{td}3B{/td}
{td}55{/td}
{td}55{/td}
{td}55{/td}
{td}55{/td}
{td}55{/td}
{td}55{/td}
{td}55{/td}
{td}55{/td}
{td}55{/td}
{td}1.5{/td}
{td}0.0{/td}
{td}0.2{/td}
{td}0.2{/td}
{td}0.14{/td}
{td}2.0{/td}
{/tr}
{tr}
{td}Elite 2B{/td}
{td}2B{/td}
{td}60{/td}
{td}60{/td}
{td}60{/td}
{td}60{/td}
{td}60{/td}
{td}60{/td}
{td}60{/td}
{td}60{/td}
{td}60{/td}
{td}1.5{/td}
{td}0.5{/td}
{td}1.5{/td}
{td}0.2{/td}
{td}0.29{/td}
{td}4.0{/td}
{/tr}
{tr}
{td}GOAT CF{/td}
{td}CF{/td}
{td}70{/td}
{td}70{/td}
{td}70{/td}
{td}70{/td}
{td}70{/td}
{td}70{/td}
{td}70{/td}
{td}70{/td}
{td}70{/td}
{td}1.5{/td}
{td}1{/td}
{td}4.1{/td}
{td}0.5{/td}
{td}0.59{/td}
{td}7.7{/td}
{/tr}
{/tbody}
[/xtable]
This isn't perfect and I still want to fine tune a few things regarding defense (some positions have higher average ratings, which skews things), but it is much better than my first fit!
TonyGin&Juice
Sucking off Lawn Guy Land hobos.
I'm looking for a project I can use in my job search since I can't use anything from my current job. Anyone know if OOTP has the ability to export ALL of the underlying raw data? I have all of the MLB PitchF/X and HitF/X for 2008-now but I'd rather using this if I could since I could actually use that for more than continuing my gambling habit. Let me know hos.
TonyGin&Juice
Sucking off Lawn Guy Land hobos.
Gambling you say?
Use to do quite a bit of that in my day
What was that, last week?
")
I'm a compulsive person so I really only like to gamble when March Madness is around. The rest of the time there's not enough chaos and action for me to pay attention.
NML
Well-Known Member
I did a lot of statistical analysis to make money gambling on soccer. There's a thread about it in the NSA area. I really well at first but then hit a meh patch, but ultimately ended up + a couple hundred after starting with $50.
But I got a job within the NCAA and can no longer gamble on sports - obviously off shore online gambling is a gray area in terms of legality anyways, but I've got no desire to lose my college coaching gig, so I stopped.
But I got a job within the NCAA and can no longer gamble on sports - obviously off shore online gambling is a gray area in terms of legality anyways, but I've got no desire to lose my college coaching gig, so I stopped.
Take your peanuts gambling talk out of this thread! This is for purist sperging.
TonyGin&Juice
Sucking off Lawn Guy Land hobos.
Take your peanuts gambling talk out of this thread! This is for purist sperging.
This from the guy that doesn't post p-values.
What do you want to know about the p-values? If I just spit out p-values without context, It'll only confuse the issue, especially because I'm running through many hypothesis as I test various interactions between ratings. My base hypothesis is: HIGHER RATINGS = MORE WARS WON and I have extremely low pvalues (0.000000000000007), indicating I can reject the null hypothesis that the "ratings in this game don't matter at all" with basically infinite certainty (much to @lloydCarr's chagrin). I don't think a pvalue is really useful in that context because I'm not really testing a hypothesis, we already know the answer (because that's how the game is programmed, higher ratings = more WARS).
So lets talk about my initial multi-variable linear regression and p-values in that context.
My hypothesis is that the following ratings: CON, GAP, POW, EYE, K's, DEF, SPE, STE, and RUN all have an independent positive linear relationship with WAR. The Null hypothesis is that the relationship is between a specific variable and WAR is not positive or independent.
[xtable=skin1|128x@]
{tbody}
{tr}
{td=64x@}Variable{/td}
{td=64x@}P-value{/td}
{/tr}
{tr}
{td}CON{/td}
{td}7.42E-07{/td}
{/tr}
{tr}
{td}GAP{/td}
{td}0.034748{/td}
{/tr}
{tr}
{td}POW{/td}
{td}1.22E-14{/td}
{/tr}
{tr}
{td}EYE{/td}
{td}1.81E-06{/td}
{/tr}
{tr}
{td}K's{/td}
{td}0.024134{/td}
{/tr}
{tr}
{td}SPE{/td}
{td}0.038016{/td}
{/tr}
{tr}
{td}STE{/td}
{td}0.18622{/td}
{/tr}
{tr}
{td}RUN{/td}
{td}0.200266{/td}
{/tr}
{tr}
{td}DEF{/td}
{td}4.5E-05{/td}
{/tr}
{/tbody}
[/xtable]
For Con, Pow, Eye, and Defense I can definitively say that, based on those p-values there is a strong independent positive linear relationship to WAR. I smash that null hypothesis
For Gap, K's, and SPE I can say that there is a very strong probability (greater than 95% but less than 99%) that those variables have an independent positive linear relationship to WAR. I reject that null hypothesis.
For STE and RUN the pvalues are high enough that I can't reject the null hypothesis, likely because they don't independently relate to WAR (they are modifiers that rely on a relationship to other ratings). I cannot reject that null hypothesis.
Last edited:
He been bitchin bout p-values for weeks now.
TonyGin&Juice
Sucking off Lawn Guy Land hobos.
So you done proved what wez already knownz. Brevo Bevo.
So you done proved what wez already knownz. Brevo Bevo.
Yeah, that was the first thing I tested when I started the analysis. The cool part was finding out the relative importance of each when it comes to WARS won.
How bout contact and avoid k combo?
Contact and Avoid Ks are the two ratings that have impact on all batting stats, basically (power kind of does as well, but only as it relates to HRs not being impacted by BABIP). Contact is the rating that drives everything and is king. Avoid K's isn't nearly as important, but serves as a positive outcome modifier for how the other ratings impact a batting statistic.
AVG = Contact is king. A positive modifier is tied to Avoid K's (which is also tied to speed) which affects BABIP + A LITTLE modifier due power and effect on BABIP (ie how much of the contact isn't "in play" because it is a HR). So a player with High Contact is going to have a good average regardless, but High Ks, high speed, and high power can all give additional +bonus adding up to the batting average, in that order.
OBP = This is basically the exact same as the average + the "eye" contribution to walks. Contact, Eye, Ks, Speed in relative order of importance (Power drops out in significance, but technically it is still positively corellated with this as well)
SLG = is driven by contact, gap, and power, with avoid Ks being a slight modifier
OPS = Driven by all 5 hitting ratings, with this order of importance: Contact > Power > Eye > Ks > Gap
TonyGin&Juice
Sucking off Lawn Guy Land hobos.
I know we have talked about this offline, but from what I can tell power is independent of contact and together they equal average.
You bammas meeting up at the Tropicana or something? What's this "offline" nonsense?
Mr. Radpants
Trog Five Standing By
Sounds like a wild party to me, don't forget your spreadsheets.
I know we have talked about this offline, but from what I can tell power is independent of contact and together they equal average.
Yeah, that's a fair way to put it.
HRs are the only "contact" where BABIP doesn't come into play. This bonus related to power isn't as big as you might think, though (for most players maybe +- 0.01 at most compared to average power?). So if Someone with 50 contact and 50 power hits .280 in a certain park, he might hit .290 average if he had 50 contact and 70 power (partially because there is an inverse relationship between power and Ks/Speed).
The lower a player's BABIP the more power bonus matters too. If a player has a BABIP of .350 and no HRs they still hit .350. If a player has a BABIP of .200 (like RUFF RIDHA back in the day) then they REALLY need those 40 dingers in 600 ABs to get them up to a respectable average. The more HRs they hit, the lower their BABIP seems to be as well, lol.
It doesn't quite work like you'd think either, as I think there are some self correcting ties between the ratings (ie players with more power typically have lower Ks rating or speed).
Lets assume players with .300 BABIP due to the same batting ratings have different power rating and therefore hit different HRs
10 HR in 600 ABS = 0.016
40 HR in 600 ABS = 0.06
Avg with 10 HRs = .316
Avg with 40 HRs= .360
That is a HUGE difference due to power, but what I found in the statistical anaylsis is that players with more power are typically missing some other area that lowers their BABIP to partially make up for the addition of Power. Anyway, this is why you can get away with a player with lower contact/Ks but high power and vice versa.
Last edited:
Which is contact, is it not? HR rating does boost it a little, but if you lower the HR rating the player's HRs just turn into singles or doubles and his avg does go down slightly. I think that's how it worked when I ran the sims, idk it's been a while. Travis' calcs don't make much sense given what I remember, but that was like OOTP14 and I'm probably wrong.
I think I cloned a guy but made one 60 and one 40 and their averages were nearly identical. I'm sure going from 70 to 30 would make a bigger difference, which seems like the 40HR to 10HR comparison. 5% seems like a lot still.
I think I cloned a guy but made one 60 and one 40 and their averages were nearly identical. I'm sure going from 70 to 30 would make a bigger difference, which seems like the 40HR to 10HR comparison. 5% seems like a lot still.
Ooooh, stat not rating. I was talking babip ratingNot exactly because HR aren't in play so they aren't part of BABIP.
BABIP rating is hidden, right? That's the piece I'm always missing in my statistical analysis.
Yeah, but it's the contact rating. It's just that Ks and HRs add to it, Ks more than HRs.BABIP rating is hidden, right? That's the piece I'm always missing in my statistical analysis.
That's why if you have a high avoid K and 45-50 contact guy you effed. In theory anyway
I shoulda know you'll were tom bout stats, im an idiot. I always enjoy talking the rating side tho because while i know how it works behind the scenes it's not like that helps while I'm in the league. I keep trying to nail down a theory on the rating scale but you really cant trust those either.
No, the babip rating is the main component of contact. Let's say 85%. Then 10% would be avoid K and 5% would be HR. Those arent accurate, just to show what i mean.I don't think HR are part of the BABIP rating either. I guess it would be avoid k part of contact. I honestly don't know. Like you said it's hard to know how those ratings interact with each other.
There is a formula that weights them, then calculates contact from that. I never really nailed it down exactly mostly because i didnt want to know. I uncovered too many secrets already and didnt want to ruin the game anymore. I forgot enough to have fun again i think
TonyGin&Juice
Sucking off Lawn Guy Land hobos.
Who gives a damn.
Plus HRs. You could find it pretty easy by pythagorazing the triangulation points of the threeYou can probably find the formula for it if you play around with commisioner mode. It's like BABIP+Avoid K's = Contract so reverse it
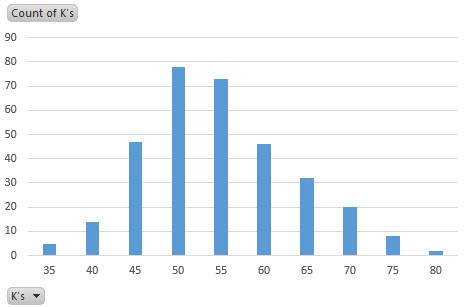
These are the frequency distributions for all hitting ratings in the current WBL. As you can see, normal distributions are generally a good assumption. Power has the most interesting distribution in that it has a high average value, but also shows acceptance of lower values. This shows that Utopians love power hitters, but are still accepting of very low power players in the big leagues as long as they have good ratings in the other hitting categories (this probably has to do with player roles). Utopians seem to value contact the most, as it is the only rating in which no player in the WBL has a value of less than 40.
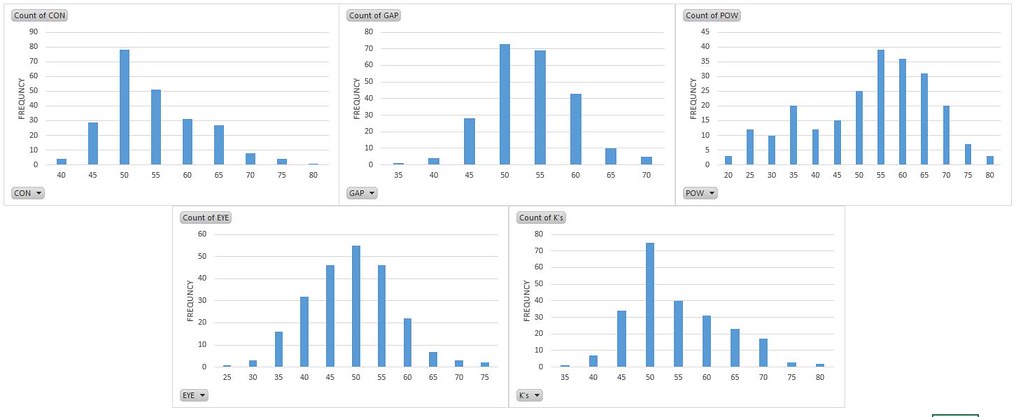
I looked at these the other day, and the biggest shift in our league is the distribution of Avoid Ks. @Gooksta's team build seems to have caught on (I'm using a larger data set in 2054, but still the change in shape of the curve is interesting).
NML
Well-Known Member
I’ll move my stat stuff here so only those interested have to see
So I’m having a hard time properly grading elite players with a linear regression, so I probably need to do a non-linear one, but excel doesn’t naturally have that ability (to my knowledge).
Other projects I want to do:
- prospect projections. Initially this is easy as you just plug in projected ratings. But I’d also like to do expected ratings jumps based on stats. I need lots of minor league data for this, which I don’t have
- more precise base running and defensive values for batters. These are generic values I’m giving based on what I see. In fact, my research with BsR showed that those values are almost entirely random (r2 of ~.05). My guess is either my data is bad or it’s not calculated correctly.
- some value/salary analysis, including how popularity will affect ticket sales. So basically how value (financially) a player provides to a club
There are several ways to do non linear regression. The easiest is to just plot the stats in a scatter plot and then "fit curve" and then select whichever non linear type you want.
I found that base running made very little difference. When you controlled for everything else, the very best baserunners were about +0.5 WAR and the very worst were about -0.5 WAR. The complicated part was the worst baserunners were the guys who had stats that were good enough to try stealing. The VERY bad guys were usually just slight -WAR as the only loss was lots of doubles and no triples, and a few less singles... but they were never even attempting to steal so they weren't getting out that way. The worst baserunners were guys getting caught a lot trying to steal and that seemed to be stealing stats around the 60 range.
I think my BTT tool had the right approach to this, in how I was weighting the hitting ratings then just using "fuzzy" math to add/subtract a bit based on defense/etc. Also, the out of position thing is the biggest issue, because position is one of the biggest drivers in WAR (when it comes to defense). There is a big positional adjustment that will drown out all the other data if you can't find out what they actually played. I didn't ever find a good way to export #games played at X position either.
NML
Well-Known Member
My counter to the defensive position thing was to focus around wRAA instead of WAR. That way, I took the defensive stats out of the regression analysis.
I initially had an r2 of .492, which is decent, but when I added in previous years wRAA (and normalized it for 600 PAs), it shot up to .59. 80% of the sample were within 20 runs of the prediction. Defensive runs and base running have their own variability too, but I don’t think you can get much closer with such a general analysis.
I think a lot of the noise can be attributed to really good or really bad players, as well as some obvious things that this data can’t capture (is this a 35 year old who just had a ratings drop? A rookie who tore it up?).
TonyGin&Juice
Sucking off Lawn Guy Land hobos.
Don’t do anything in Excel.
I use EXCEL because my boss and clients can understand it well enough to use it.
EXCEL is like a swiss army knife, in that you can accomplish almost anything using it, and anyone can use it... but it is also never the right tool for the job. Then sometimes you close the knife on ur finger while trying to use the corkscrew.
EXCEL is like a swiss army knife, in that you can accomplish almost anything using it, and anyone can use it... but it is also never the right tool for the job. Then sometimes you close the knife on ur finger while trying to use the corkscrew.
Mr. Radpants
Trog Five Standing By
I’ll move my stat stuff here so only those interested have to see
You can't hide from me
NML
Well-Known Member
There are several ways to do non linear regression. The easiest is to just plot the stats in a scatter plot and then "fit curve" and then select whichever non linear type you want.
I tried using the solver add in but apparently we are as optimized as possible
Here's what I have for correlation between the variables I used. I'll bump the travis post to see how they compare
Contact: 1.18
Power: .56
Eye: .44
Avoid Ks: .28
Previous NwRAA: .16
Gap: .10