-
Registration is disabled due to constant spammers. Email [email protected] and we will temporarily re-enable registration for you.
You are using an out of date browser. It may not display this or other websites correctly.
You should upgrade or use an alternative browser.
You should upgrade or use an alternative browser.
WBL Rule Change Thread
- Thread starter OU11
- Start date
Wendell Gee
dawg_gone parrothead
I'll pay $59.99 to get in the Adderall pool.
I think it values defense more at some positions and hitting more at others.So either ootp values different bats for different positions or its normalized. That blows, it's back to useless. I really wish it was just how good they are at the position
I think it values defense more at some positions and hitting more at others.
Definitely values defense at CF. I've noticed a couple CF's with crappy batting ratings, but they had like 70 or 75 range and they were higher stars than a CF with 60 range and much better offensive ratings.
I think it values defense more at some positions and hitting more at others.
That would make sense.
found this post from 2003 from Markus. Not sure if it's still in play but it sounds right. @Travis7401
Originally posted by Markus Heinsohn
OK guys, I am back from vacation. I checked the boards and feel that it'd be a good thing to explain the star rating a little in detail...
Gold stars=Major league player
Blue stats=Prospect
The star rating rates players against the other players of the leagues at the same position. Stats are not used here, just the ratings, which are calculated into one single value number.
Here are the breakdowns:
45% - infinitly better than the league average at the position: 5.0 Stars
30% - 45%: 4.5
20% - 30%: 4.0
10% - 20%: 3.5
0% (average) - 10%: 3.0
worse 15% to average: 2.5
worse 25% to 15%: 2.0
worse 30% to 25%: 1.5
worse more than 30%: 1.0 Stars
Sometimes even the best players at their position are not better than 45% than the league average, so at times there may be no 5.0 star players at talent-loaden positions!
Prospects are rated differently, using a rather complex formula that does not use the league average, but solely the talent ratings + other ratings like speed, range, duration etc.
Karl Hungus
Here to fix the cable
All you need to know about stars is this- look up Caffar Stonestreet, look at his 4.5*, and look at the pile of shit his stats are.
Karl Hungus
Here to fix the cable
Wrong thread.
For a $39.99 subscription to the BTT system, you can have a BTT "true talent" rating for every player on your roster that will predict essentially what his WAR will be at a given position. I will also show you where they relate compared to all players in the WBL and all players at their position in the WBL.
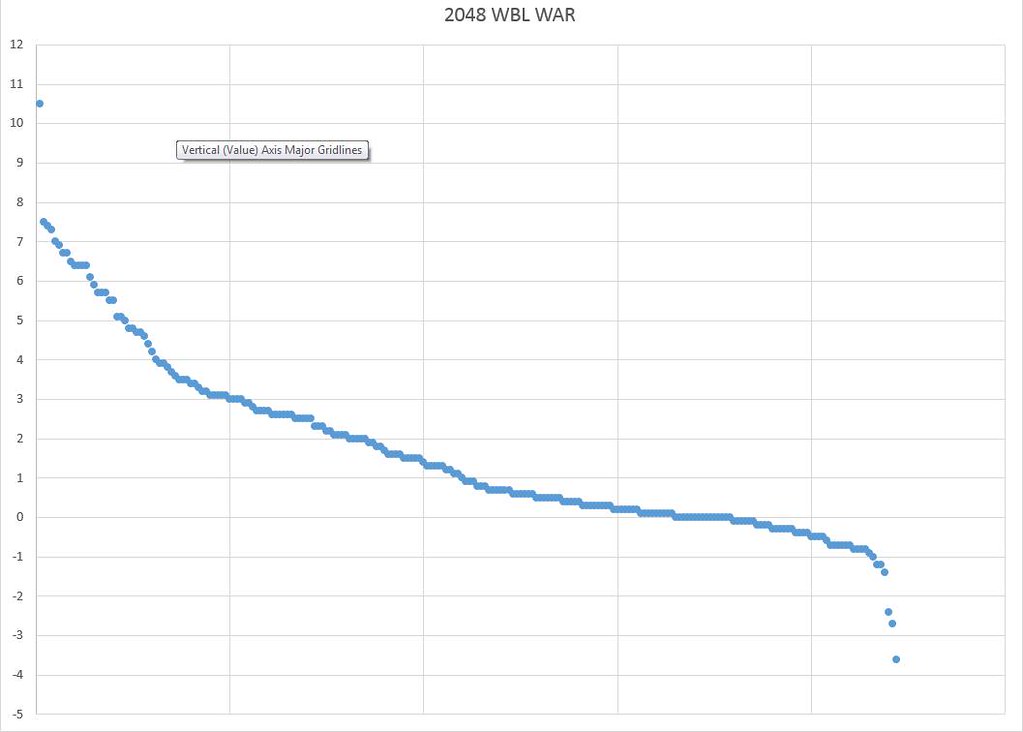
FWIW, here is the 2048 WBL* version of this graph based on WAR. There are only 222 entries in my table, which makes me think I'm only able to view current major league roster players who played in 2048 as well, so guys who were called up fresh in 2049 and guys who are retired now are probably excluded (estimated 13 "batters" per team on 25 man roster X 18 teams should be > 234 major league players especially if call ups were made)? This is why I need to wait until the end of the 2049 season for a more thorough statistical analysis of how the game operates, but for now it is pretty clear that the WAR curve is actually similar to real baseball. I'll post a distribution later and can also create pivot tables where I compare player ratings vs their statistics (ie if you want to know which batting ratings contribute most to each batting stat).
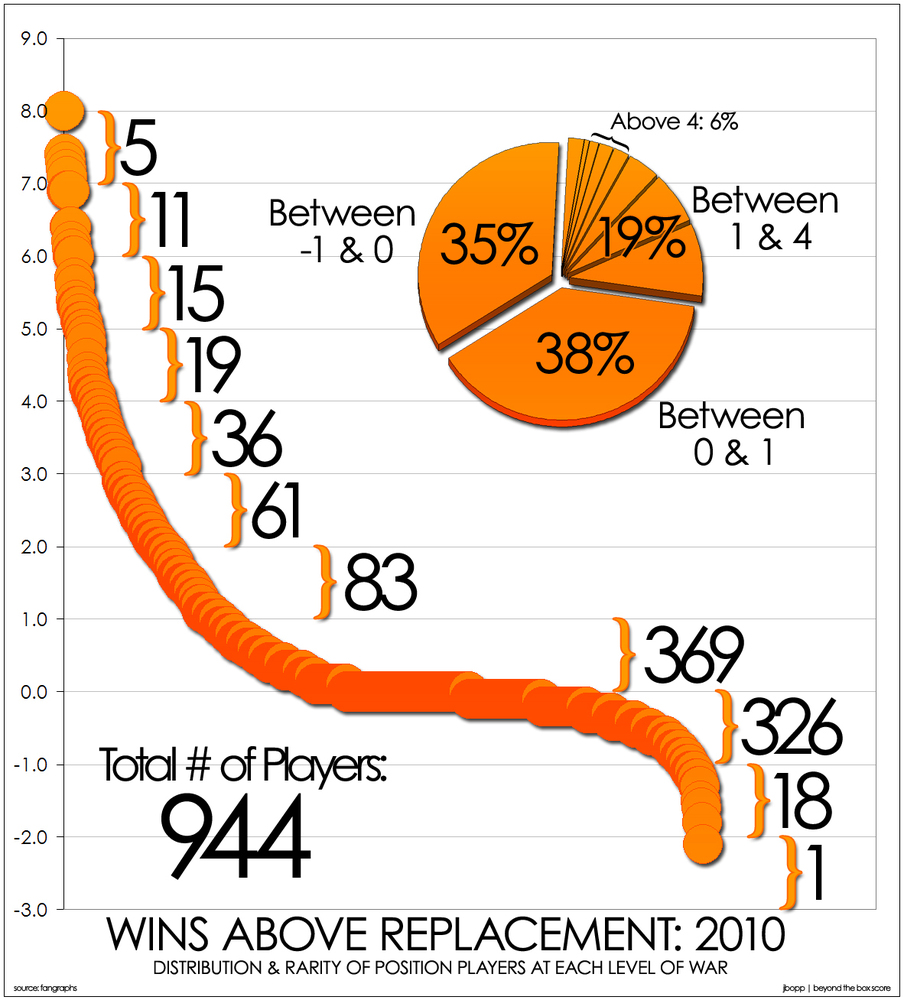
I don't have the raw data associated with the 2010 Real life MLB chaart, but you can make some inferences based on the bins they used. 73% of MLB players fell within -1 to 1 WAR range, which means a standard deviation must be slightly less than 1. Lets call it 0.9. The Median WAR rating for batters looks like it was about 0.1. One standard deviation from there would mean in the negative direction would be a -0.8 WAR player and that would correspond with a "40 overall" player rating. 1 standard deviation in the positive direction would yield a WAR of approximately 1.0 and would correspond with a "60 Overall" player rating.
You can see the curves have pretty similar shapes, which means that we can certainly approximate the WBL using a normal distribution (though it is definitely skewed) and have a fairly reliable predictor of the WAR those players will actually generate.... but the curve is shifted up a bit. The Median is 0.9 and the Mean is 1.6 and the standard deviation is 2.2. If we were to approximate this with a normal distribution, one standard deviation in either direction of the mean would correspond to -0.6 to 3.8 WAR. This means a player rated as a "40 overall" on a normal distribution might be expected to generate a WAR of -0.6 while a player rated as a "60 overall" might be expected to generate a WAR of 3.8. Basically, we are rocking some grade inflation in the WBL. Tommorow night I'll plot a histogram and compare it to a normal distribution so you can see how the data is skewed but why a normal distribution is still a good approximation of the data. It is worth noting how much of an outlier Carrier is up there on his own. He's nearly 4 standard deviations above the average WBL player, which would be HOF/GOAT level performance in any sports league. I assume those shitheads at the bottom played for @Reel ?
doh
THANK YOU Dermott McHeshi
Ok I take back what I said about interesting. This is the most in depth and interesting post in this history of the league. Bravo.
I actually signed the -3.6 WAR guy in Brito. He had like -40 ZRs so offensively he was actually a positive player. For some reason Reel used him in CF a ton. But I'm going to use him as a vs LHP DH and bench player who spot starts vs RHP. He's got 75 power which is nice.
I actually signed the -3.6 WAR guy in Brito. He had like -40 ZRs so offensively he was actually a positive player. For some reason Reel used him in CF a ton. But I'm going to use him as a vs LHP DH and bench player who spot starts vs RHP. He's got 75 power which is nice.
Gooksta
Well-Known Member
how bout players on winning team playing above their ratings as something to look into alsoFWIW, here is the 2048 WBL* version of this graph based on WAR. There are only 222 entries in my table, which makes me think I'm only able to view current major league roster players who played in 2048 as well, so guys who were called up fresh in 2049 and guys who are retired now are probably excluded (estimated 13 "batters" per team on 25 man roster X 18 teams should be > 234 major league players especially if call ups were made)? This is why I need to wait until the end of the 2049 season for a more thorough statistical analysis of how the game operates, but for now it is pretty clear that the WAR curve is actually similar to real baseball. I'll post a distribution later and can also create pivot tables where I compare player ratings vs their statistics (ie if you want to know which batting ratings contribute most to each batting stat).
I don't have the raw data associated with the 2010 Real life MLB chaart, but you can make some inferences based on the bins they used. 73% of MLB players fell within -1 to 1 WAR range, which means a standard deviation must be slightly less than 1. Lets call it 0.9. The Median WAR rating for batters looks like it was about 0.1. One standard deviation from there would mean in the negative direction would be a -0.8 WAR player and that would correspond with a "40 overall" player rating. 1 standard deviation in the positive direction would yield a WAR of approximately 1.0 and would correspond with a "60 Overall" player rating.
You can see the curves have pretty similar shapes, which means that we can certainly approximate the WBL using a normal distribution (though it is definitely skewed) and have a fairly reliable predictor of the WAR those players will actually generate.... but the curve is shifted up a bit. The Median is 0.9 and the Mean is 1.6 and the standard deviation is 2.2. If we were to approximate this with a normal distribution, one standard deviation in either direction of the mean would correspond to -0.6 to 3.8 WAR. This means a player rated as a "40 overall" on a normal distribution might be expected to generate a WAR of -0.6 while a player rated as a "60 overall" might be expected to generate a WAR of 3.8. Basically, we are rocking some grade inflation in the WBL. Tommorow night I'll plot a histogram and compare it to a normal distribution so you can see how the data is skewed but why a normal distribution is still a good approximation of the data. It is worth noting how much of an outlier Carrier is up there on his own. He's nearly 4 standard deviations above the average WBL player, which would be HOF/GOAT level performance in any sports league. I assume those shitheads at the bottom played for @Reel ?
Gooksta
Well-Known Member
I agree.. the numbers are wackBring the STARZ back pls.
I was actually pretty close to having a nice frequency distribution graph that compared the actual distribution to the Normal Distribution so you could see the skew better, but then EXCEL crashed on me @Brick. Then I was also going to compare that distribution to the distribution of star values for those same players, to show why the "overall" star rating that OOTP produces is so wonky. Now that I figured out how I can easily look back at the 2048 and 2047 stats, I'll do some cool data analysis this weekend and share the results in another thread that I'll make for statistical analysis.
There are more than 5, i counted 13There are 5 80/80 rated players in the WBL at the moment. Amsterdam has 3 of them
Lloyd Carr
Well-Known Member
Bring the STARZ back pls.
STARZ and overall rating.

doh
THANK YOU Dermott McHeshi
I think that WAR is skewed up because of the amount of teams tanking. There have been too many truly terrible teams and that leads to higher WARs.That post confirms what I thought though, we're kind of in a boom time right now in terms of talent. From the feeder tests that will come to an end after this group ages.
Lloyd Carr
Well-Known Member
Yeah, I'm still in the "overall" camp.
I'd rather know how good of a player the guy actually is. I feel it's a more accurate representation of the type of player the guy is.
I'd rather know how good of a player the guy actually is. I feel it's a more accurate representation of the type of player the guy is.
Yeah, I'm still in the "overall" camp.
I'd rather know how good of a player the guy actually is. I feel it's a more accurate representation of the type of player the guy is.
To me, I'd rather know how good a player is at his position, to me. I don't care though since apparently they use some funky way of doing things
Lloyd Carr
Well-Known Member
To me, I'd rather know how good a player is at his position, to me. I don't care though since apparently they use some funky way of doing things
My concern with positional rating is that a guy like Dani Gonzales is like a 4* (62 on the number scale) rated guy under that metric.
While he's got solid defensive ratings, his play doesn't really seem to back up that rating. He's always been rated between 3-4 stars, and he's never really produced what that star level should produce. So I'm curious to see what he'd look like overall without his position being taken into account.
What's his STARRRZZZ situation look like based on overall rating?
Gooksta
Well-Known Member
Game probably weights defensive metrics more for a 2B than the league does.My concern with positional rating is that a guy like Dani Gonzales is like a 4* (62 on the number scale) rated guy under that metric.
While he's got solid defensive ratings, his play doesn't really seem to back up that rating. He's always been rated between 3-4 stars, and he's never really produced. So I'm curious to see what he'd look like overall without his position being taken into account.
What's his STARRRZZZ situation look like based on overall rating?
He is an elite middle infielder defensively..
Mr. Radpants
Trog Five Standing By
So many starz and I couldn't give him away last season.
Also, BANT
Lloyd Carr
Well-Known Member
Game probably weights defensive metrics more for a 2B than the league does.
He is an elite middle infielder defensively..
He may be an elite middle infielder defensively, but that doesn't make him overall an elite player.
The game ranks Dani a 62 and Luong a 58.
Luong is horrible at defense, but is a career 25 WAR player. Dani is a career -1.1 WAR player.
That doesn't make sense to me. And before you say, "well Dani is on pace for a better WAR than Luong this year," Dani has been a 3-4 star potential player since his days of batting .197 in AA.
They arent based on performance, it is just ratings. So he might be better when not using position. A guy could hit .101 his whole career and be a 5* because his ratings merit it.My concern with positional rating is that a guy like Dani Gonzales is like a 4* (62 on the number scale) rated guy under that metric.
While he's got solid defensive ratings, his play doesn't really seem to back up that rating. He's always been rated between 3-4 stars, and he's never really produced what that star level should produce. So I'm curious to see what he'd look like overall without his position being taken into account.
What's his STARRRZZZ situation look like based on overall rating?
Ratings. War has nothing to do with it. Overall is just for ratings. It shows you what they can do not what they will doHe may be an elite middle infielder defensively, but that doesn't make him overall an elite player.
The game ranks Dani a 62 and Luong a 58.
Luong is horrible at defense, but is a career 25 WAR player. Dani is a career -1.1 WAR player.
That doesn't make sense to me. And before you say, "well Dani is on pace for a better WAR than Luong this year," Dani has been a 3-4 star potential player since his days of batting .197 in AA.
Lloyd Carr
Well-Known Member
Ratings. War has nothing to do with it. Overall is just for ratings. It shows you what they can do not what they will do
Just out of curiosity though, what is Dani's star situation based on the overall rating? Also what would Luong's be?
Can you check with your commish powers?
Gooksta
Well-Known Member
Starz are based off physical ability.. I think baserunning ability is a small part of the equation alsoHe may be an elite middle infielder defensively, but that doesn't make him overall an elite player.
The game ranks Dani a 62 and Luong a 58.
Luong is horrible at defense, but is a career 25 WAR player. Dani is a career -1.1 WAR player.
That doesn't make sense to me. And before you say, "well Dani is on pace for a better WAR than Luong this year," Dani has been a 3-4 star potential player since his days of batting .197 in AA.
Just out of curiosity though, what is Dani's star situation based on the overall rating? Also what would Luong's be?
Can you check with your commish powers?
2.5* for both guys overall. When taking defense into account, luong is a 3* and Dani is a 3.5*
Lloyd Carr
Well-Known Member
See, I'd rather know that 2.5* rating.
I don't really need defensive acumen calculated into an overall rating, since I can tell how good a guy is defensively by the eye test of seeing his ratings.
I don't really need defensive acumen calculated into an overall rating, since I can tell how good a guy is defensively by the eye test of seeing his ratings.
Gooksta
Well-Known Member
Messing around with my spreadsheets.. I had a formula that pretty matched up with how the game ranked them off the star system.. I realized the star system wasn't that important at that time..See, I'd rather know that 2.5* rating.
I don't really need defensive acumen calculated into an overall rating, since I can tell how good a guy is defensively by the eye test of seeing his ratings.
Lloyd Carr
Well-Known Member
Messing around with my spreadsheets.. I had a formula that pretty matched up with how the game ranked them off the star system.. I realized the star system wasn't that important at that time..
The star system wasn't important when based on positional ranking?
See, I'd rather know that 2.5* rating.
I don't really need defensive acumen calculated into an overall rating, since I can tell how good a guy is defensively by the eye test of seeing his ratings.
It is factored in anyway, I'm guessing it is just weighted differently depending on how hard it is to defend at whatever position you are looking at
To me it sounds like @Lloyd Carr should just subscribe to my BTT system and I'll give him a true overall rating as a field player (as well as a rating for any position in which you want to play him) which will predict his actually WAR value for the season.
Lloyd Carr
Well-Known Member
To me it sounds like @Lloyd Carr should just subscribe to my BTT system and I'll give him a true overall rating as a field player (as well as a rating for any position in which you want to play him) which will predict his actually WAR value for the season.
If you ever get fired from the Riggers job, I think Mustard Tiger (my owner) would be interested in bringing you over to the Murricans as a consultant.
Gooksta
Well-Known Member
Well sorta. But looking at all the players in a positional group or overall on my spreadsheet, it made me realize that a lot of players with a decent star rating wouldn't be as productive as others based off what I felt made a productive player..the game ratings just had a simple rating system which seemed to overvalue defense and speed a lil too much for my liking.. which is now obvious with this Convo..so I changed the formula to find what I wanted.. . but it's all about preferences and what matters to you or how you want to construct your rosterThe star system wasn't important when based on positional ranking?
Lloyd Carr
Well-Known Member
So I can do this... it changes the overall rating to AI evaluation which uses these 4 settings.

See, I think those are the metrics that make the most sense for evaluating how to rate a guy. Stars make the most sense (to me at least) as an evaluation of a players overall abilities as a baseball player. You've got their ratings and stats, and the stars indicate how good of a player they are when all of that is meshed into a general observable evaluation of a player's merits.
Example:
Darrach and Dani have the same ratings (well, close enough), but their star situation is a lot different. And that bugs me, because Dani is rated higher (star wise), even though he's not playng (nor has be ever played) better than Darrach.
I think the metrics in your post are a more accurate style for what to use when evaluating the overall skill of a player. And when I think of stars, the overall skill of a player is what I envision those stars represent.
I bet if you used those metrics in that post, Darrach would have more stars than Dani. Or at least it would make more sense to me for Darrach to have more stars. Maybe Dani has more potential stars because he's younger and the scouts think he has more long term potential? But overall, it doesn't make sense for Dani to be higher (in stars) than Darrach.
I'm curious if changing those metrics would support that or not.
Lloyd Carr
Well-Known Member
Well sorta. But looking at all the players in a positional group or overall on my spreadsheet, it made me realize that a lot of players with a decent star rating wouldn't be as productive as others based off what I felt made a productive player..the game ratings just had a simple rating system which seemed to overvalue defense and speed a lil too much for my liking.. which is now obvious with this Convo..so I changed the formula to find what I wanted.. . but it's all about preferences and what matters to you or how you want to construct your roster
See, I think most people can agree with this. Which makes me question why we should maintain the status quo for what the stars represent.
There's a reason we say STARRRRZZZ. I think we should do something to make the stars more relevant.
How old is dani? Obviously scouts think he could be an average bat with glove wizard defense. Thats what a 3.5* 80 defender means.See, I think those are the metrics that make the most sense for evaluating how to rate a guy. Stars make the most sense (to me at least) as an evaluation of a players overall abilities as a baseball player. You've got their ratings and stats, and the stars indicate how good of a player they are when all of that is meshed into a general observable evaluation of a player's merits.
Example:
Darrach and Dani have the same ratings (well, close enough), but their star situation is a lot different. And that bugs me, because Dani is rated higher (star wise), even though he's not playng (nor has be ever played) better than Darrach.
I think the metrics in your post are a more accurate style for what to use when evaluating the overall skill of a player. And when I think of stars, the overall skill of a player is what I envision those stars represent.
I bet if you used those metrics in that post, Darrach would have more stars than Dani. Or at least it would make more sense to me for Darrach to have more stars. Maybe Dani has more potential stars because he's younger and the scouts think he has more long term potential? But overall, it doesn't make sense for Dani to be higher (in stars) than Darrach.
I'm curious if changing those metrics would support that or not.
But yeah i could change the stars to an ai evaluation based system with whatever settings we want to out in there. I thought that was for the ratings but apparently it's for the starzz.
So that would make it a bit more realistic and we could take the ratings completely out and just base it on play which would allow for a normal distribution like @Travis7401 wants
Gooksta
Well-Known Member
I'll just say this.. if a player has high defensive and base running ratings.. his hit ratings don't have to be as high to be of equal or greater value of a decent offensive player with bad defensive or base running ratings.. it's a give and takeSee, I think those are the metrics that make the most sense for evaluating how to rate a guy. Stars make the most sense (to me at least) as an evaluation of a players overall abilities as a baseball player. You've got their ratings and stats, and the stars indicate how good of a player they are when all of that is meshed into a general observable evaluation of a player's merits.
Example:
Darrach and Dani have the same ratings (well, close enough), but their star situation is a lot different. And that bugs me, because Dani is rated higher (star wise), even though he's not playng (nor has be ever played) better than Darrach.
I think the metrics in your post are a more accurate style for what to use when evaluating the overall skill of a player. And when I think of stars, the overall skill of a player is what I envision those stars represent.
I bet if you used those metrics in that post, Darrach would have more stars than Dani. Or at least it would make more sense to me for Darrach to have more stars. Maybe Dani has more potential stars because he's younger and the scouts think he has more long term potential? But overall, it doesn't make sense for Dani to be higher (in stars) than Darrach.
I'm curious if changing those metrics would support that or not.